
Car Sales figures May 2023 – Car sales figures for the month of May have been released.

Highlights include a 12% increase on the same month last year and some 105,894 new vehicle deliveries.
Growth was spread across all the segments.
The year-to-date sales of 456,833 is 4.3 per cent higher than the same period last year.
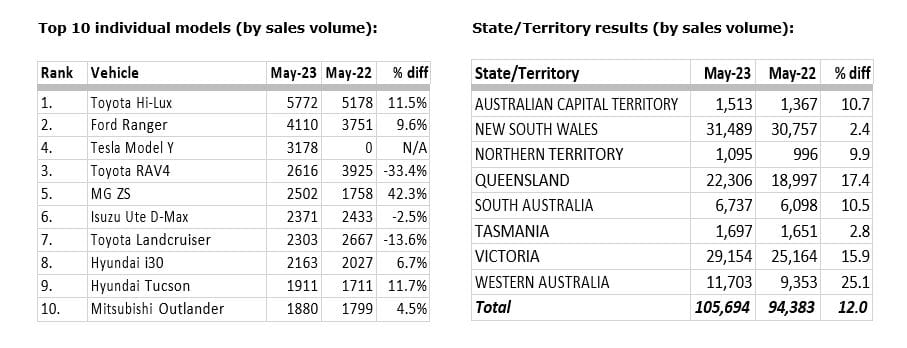
Three of the top ten vehicles sold were Utes, with HiLux regaining its first-place position followed by Ranger. Four more were 4WDs or SUVs, two were Electric cars and one passenger car.
The top ten manufacturers were Toyota, again with a slightly reduced gap to Mazda. Kia, Ford and Hyundai make up the top five.
Followed by Mitsubishi, MG, Tesla, Subaru and Isuzu Ute.
SUVs continue to dominate with a little over 55% of sales, Light Commercial Vehicles near 22%, Passenger cars 18% and trucks some 4.4%
Petrol is still the most popular fuel source by a huge margin. Diesel is next.
Sales of Electric cars are slowly increasing, mostly a product of filling back orders and supply deliveries. Hybrid sales remain strong.
This is a Motoring Minute
Im Rob Fraser
TO LISTEN TO THE CAR SALES YTD RADIO REVIEW CLICK BELOW
More car sales YTD May 2023 details
Australia’s automotive industry has achieved its best-ever May sales result with 105,694 new vehicle deliveries.
This result is a 12.0 per cent increase on the same month last year and represents a 2.7 per cent increase on May 2017 which was the previous best May result. The year-to-date sales of 456,833 is 4.3 per cent higher than the same period last year.
Every State and Territory saw an increase with significant growth in Western Australia of 25.1 per cent and Queensland 17.4 per cent compared with May 2022. Growth was recorded in all buyer type market segments – Private, Business, Government and Rental – compared with May 2022.
FCAI Chief Executive Tony Weber said the result was encouraging following many months where deliveries were hampered by shipping and logistics issues.
“This result is a signal that we are starting to see some improvement in supply,” Mr Weber said. “However, not all issues are resolved, and our members continue to work with their customers to improve vehicle delivery times.”
Mr Weber added that while vehicle supply issues might be beginning to ease, the industry remained cautious around broader economic conditions and their potential impact on demand.
“A large proportion of vehicles delivered this month would have been ordered during 2022,” he said. “Since then, we have seen a shift in economic conditions with a focus on rising cost pressures for households and businesses. Nevertheless, reports from our members indicate that demand remains firm.”
Breakdown
Sales of Battery Electric Vehicles were 7.7 per cent of the market in May and are running at 7.0 per cent year to date. Sales for electrified vehicles (Battery Electric Vehicle, Plug-In Hybrid and Hybrid) made up 15.6 per cent of the market in May.
Toyota (18,340) was the market leader in May followed by Mazda (8,475), Hyundai (7,078), Kia (7,000) and Ford (6,251).
The Toyota Hi-Lux (5,772) was the largest-selling model followed by Ford Ranger (4,110), Tesla Model Y (3,178), Toyota RAV4 (2,616) and MG ZS (2,502).
VFACTS MAY 2023
Summary by Class:
| Class | Jan-23 | Feb-23 | Mar-23 | Apr-23 | May-23 | TOTAL | |
| Passenger | 16,602 | 16,435 | 17,182 | 15,191 | 18,120 | 83,530 | |
| SUV | 46,698 | 47,888 | 53,526 | 46,031 | 59,011 | 253,154 | |
| Light Commercial | 18,546 | 18,750 | 22,012 | 17,060 | 23,824 | 100,192 | |
| Heavy Commercial | 3,027 | 3,805 | 4,531 | 3,855 | 4,739 | 19,957 | |
| TOTAL | 84,873 | 86,878 | 97,251 | 82,137 | 105,694 | 456,833 |
Key Points:
- The May 2023 market of 105,694 new vehicle sales is an increase of 11,311 vehicle sales or 12.0% against May 2022 (94,383). There were 26.8 selling days in May 2023 compared to 25.8 in May 2022 and this resulted in an increase of 285.6 vehicle sales per day.
- The Passenger Vehicle Market is up by 868 vehicle sales (5.0%) over the same month last year; the Sports Utility Market is up by 7,552 vehicle sales (14.7%); the Light Commercial Market is up by 2,296 vehicle sales (10.7%) and the Heavy Commercial Vehicle Market is up by 595 vehicle sales (14.4%) versus May 2022.
- Toyota was market leader in May, followed by Mazda and Hyundai. Toyota led Mazda with a margin of 9,865 vehicle sales and 9.4 market share points.
Car Sales Results YTD May 2023
| Report for the Month of | Year to Date | Year to Date | Month | |||||
| May 2023 YTD | May-23 | May-22 | May-23 | |||||
| Standings | Marque | Volume | Share | Volume | Share | Volume | Share | |
| 1 | ▼ | Toyota | 71,287 | 15.6% | 98,816 | 22.6% | 18,340 | 17.4% |
| 2 | ▼ | Mazda | 40,718 | 8.9% | 43,687 | 10.0% | 8,475 | 8.0% |
| 3 | ▲ | Kia | 31,609 | 6.9% | 30,939 | 7.1% | 7,000 | 6.6% |
| 4 | ▲ | Ford | 30,429 | 6.7% | 23,590 | 5.4% | 6,251 | 5.9% |
| 5 | ▼ | Hyundai | 29,492 | 6.5% | 29,908 | 6.8% | 7,078 | 6.7% |
| 6 | ▼ | Mitsubishi | 25,662 | 5.6% | 35,902 | 8.2% | 4,583 | 4.3% |
| 7 | ▲ | MG | 20,676 | 4.5% | 20,104 | 4.6% | 4,828 | 4.6% |
| 8 | ▲ | Tesla | 18,559 | 4.1% | 4,481 | 1.0% | 4,476 | 4.2% |
| 9 | ▲ | Subaru | 17,582 | 3.8% | 13,422 | 3.1% | 3,564 | 3.4% |
| 10 | ▲ | Isuzu Ute | 16,746 | 3.7% | 15,332 | 3.5% | 3,481 | 3.3% |
Source: VFACTS
Motoring Minute is heard around Australia every day on over 50 radio channels through the Torque Radio network.
Motoring Minute has an average daily audience of over 550,000 listeners. They are also syndicated through various news sites around Australia.
Additionally Motoring Minute is also broadcast as part of Overdrive Radio Program. Overdrive is broadcast on the Community Radio Network across Australia.